I'm back. In my previous post:viewtopic.php?p=25370#p25370, the problem may not have been described clearly. I have made a lot of attempts during this period, and I would like to describe my running process in more detail. There may be other users who encounter the same problem, and we can discuss it together.
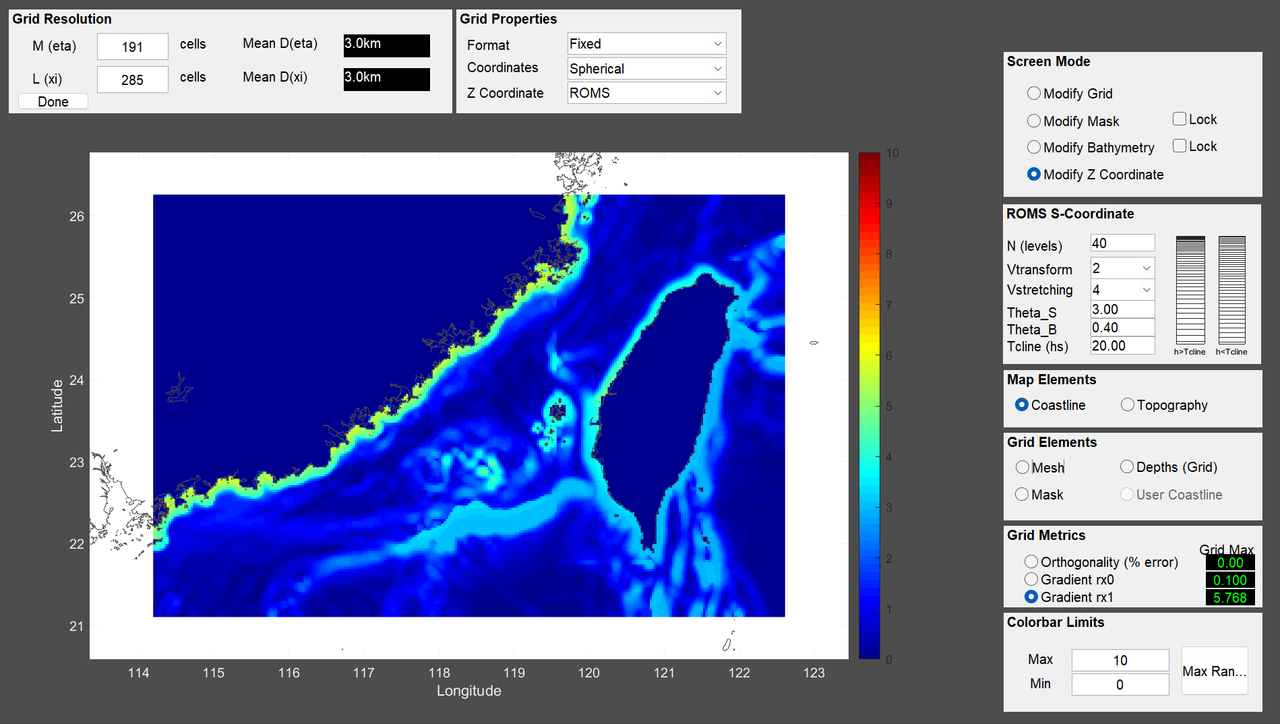
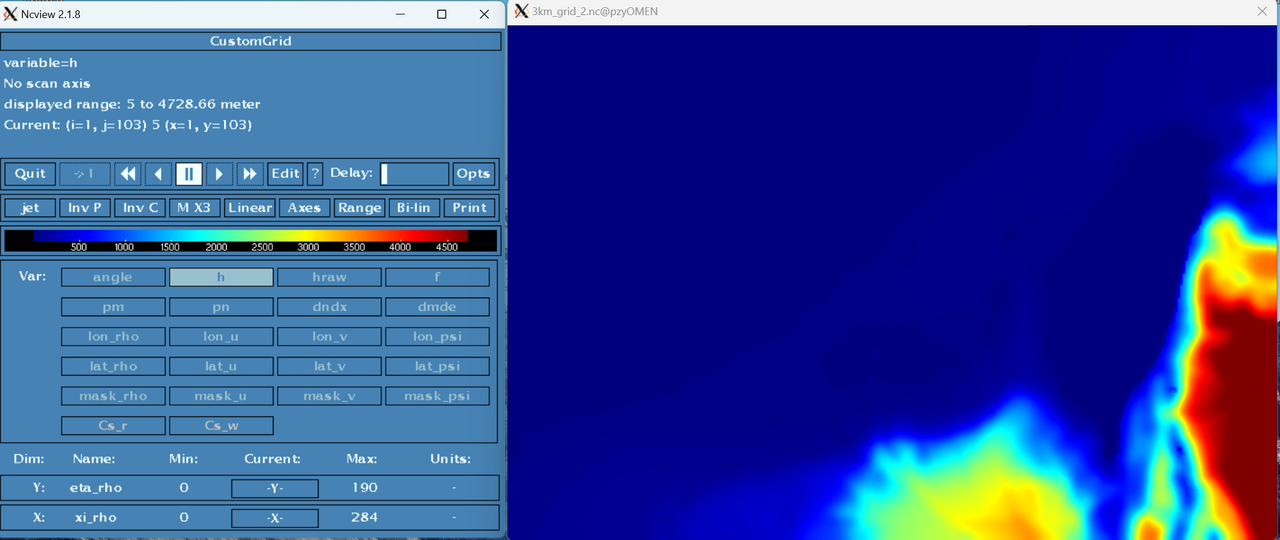
First, a well-behaved terrain reduces the potential risk of model blowup. GridBuilder is really a powerful tool for generating ROMS grids, and I also wrote a matlab script to modify the land elevation of the generated grid to the minimum water depth, and made appropriate smoothing in the place where the slope of the terrain changed too much, and got a grid with good performance of various parameters - it was not overly smooth, and the grid stiffness and orthogonality were not crazy.
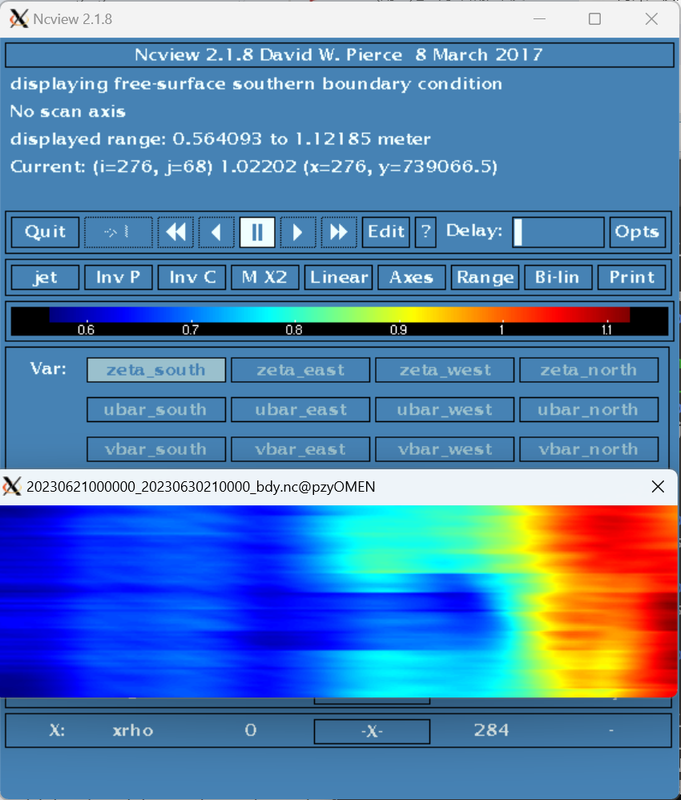
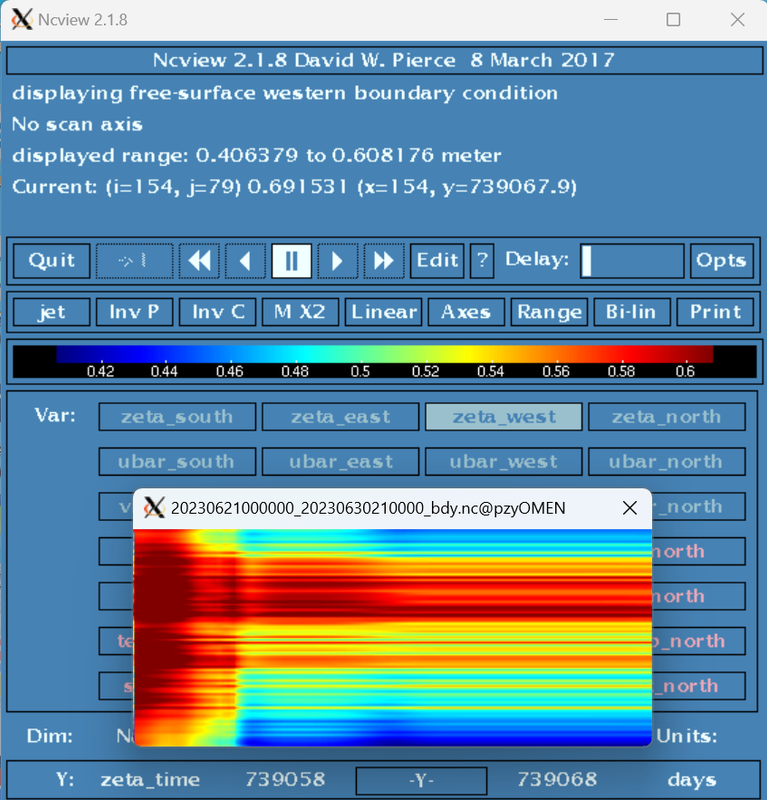
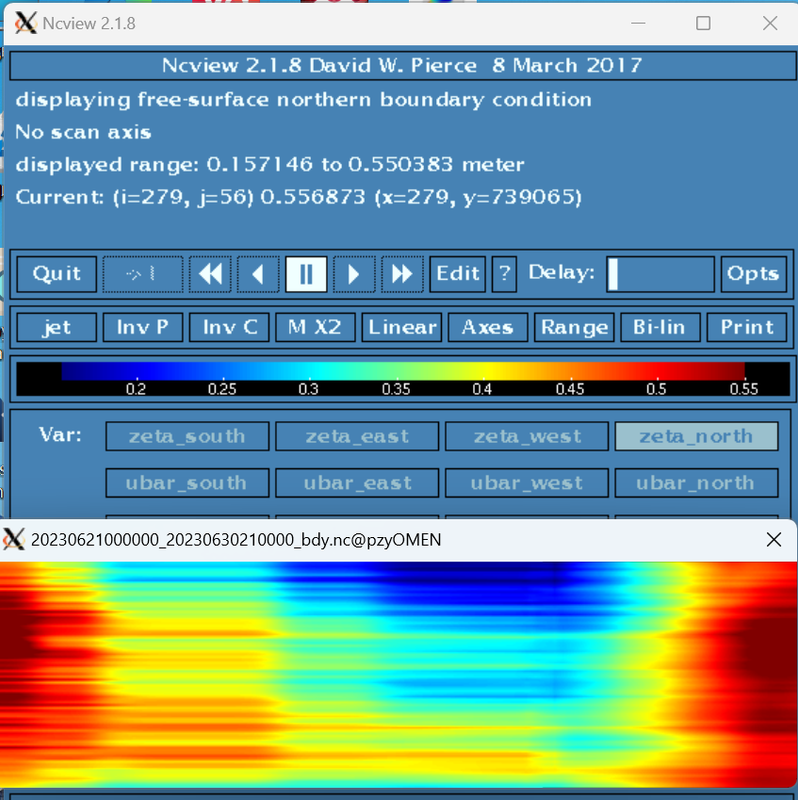
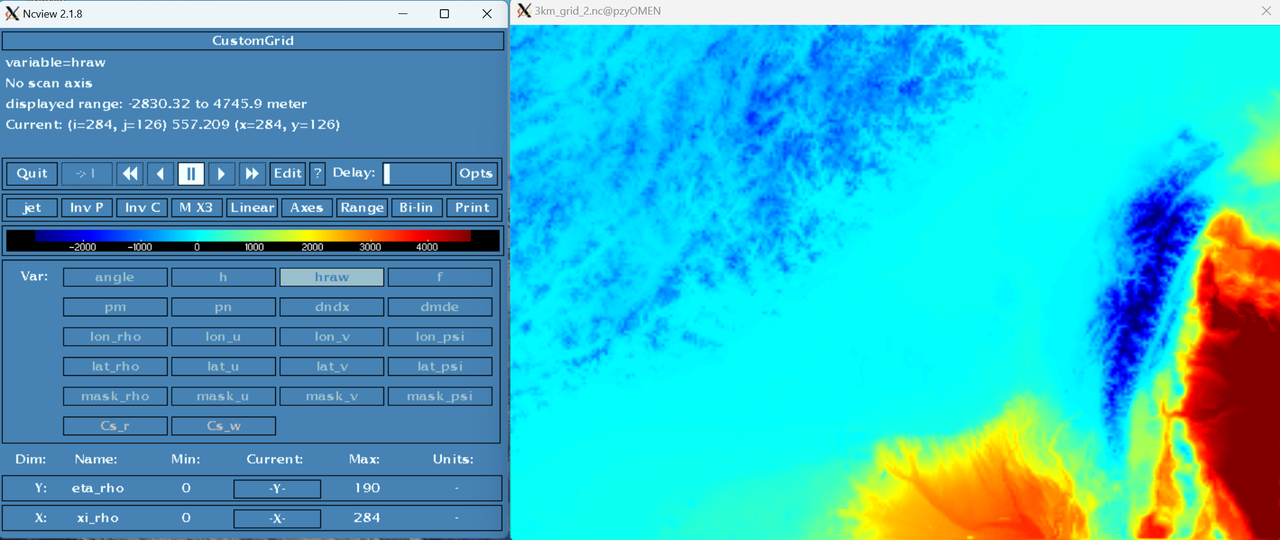
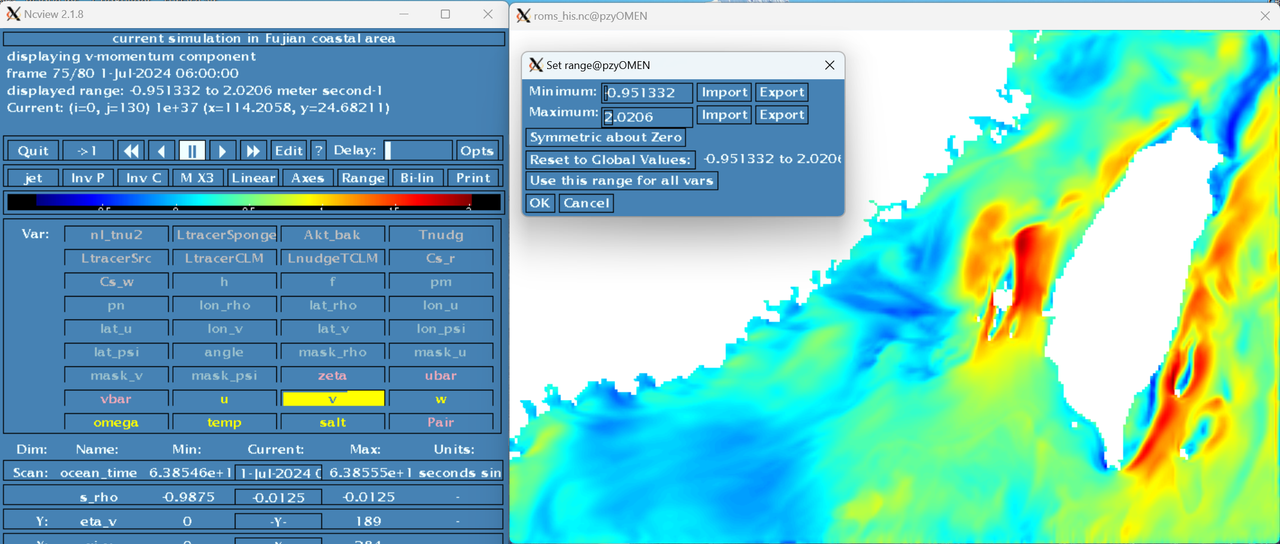
I then used roms_clm/roms_master_climatology_coawst_mw.m to make ini, bdy and clm files (from hycom), and used my own script with mtools/create_roms_forcings to generate the surface force file (source ERA5). I have carefully examined these files and found that the zeta data seems to be somewhat discontinuous(shown below)... I'm not sure if this is the hycom dataset as it is or if there was an error in my interpolation process.
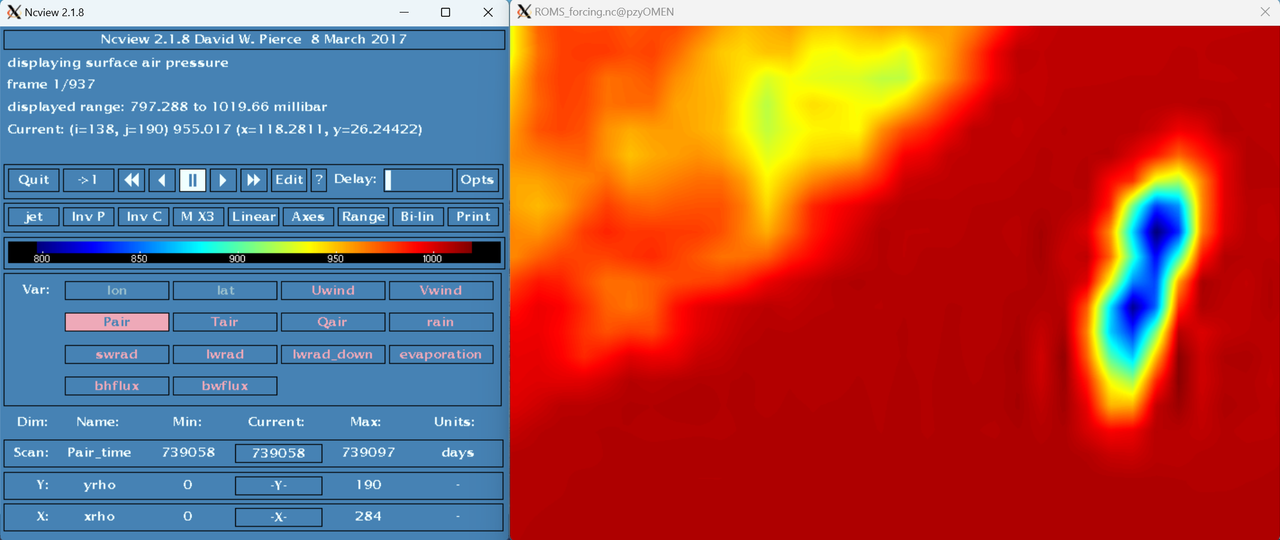
I now have a delicate problem: as stated earlier, I changed all the land elevation in the grid to the minimum water depth (hmin = 5m in my example), because as far as I know, the ROMS calculates all the points in the model domain and then masks out the result of the land. Therefore, in the model domain, no h < 0 can occur. What makes me uneasy, however, is that there are actually some very high mountains in my model domain, and the ERA5 data shows that the pressure in these places is much lower than the typical value of 1000mb at sea level. Since my forcing files are interpolated from ERA5 data in the grid, could these false low pressures be a potential cause of ROMS blowup?
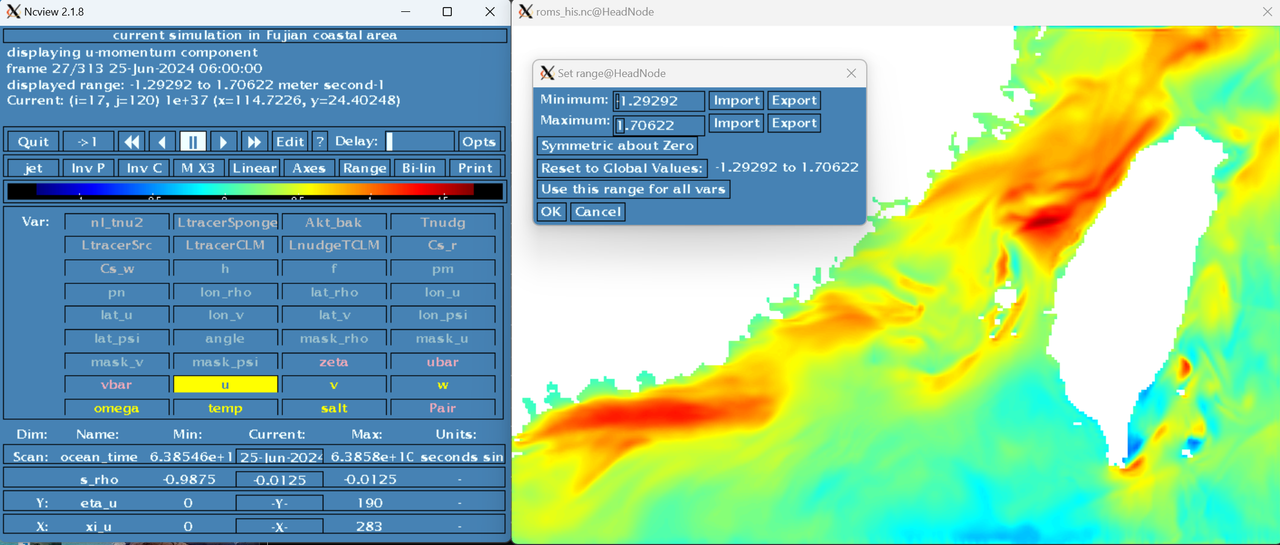
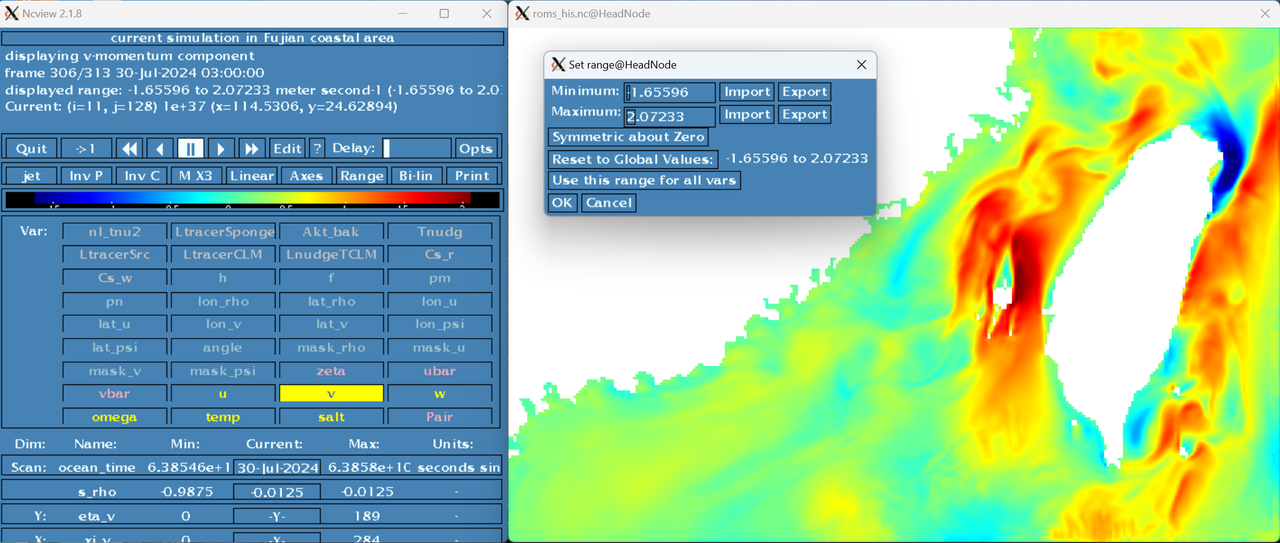
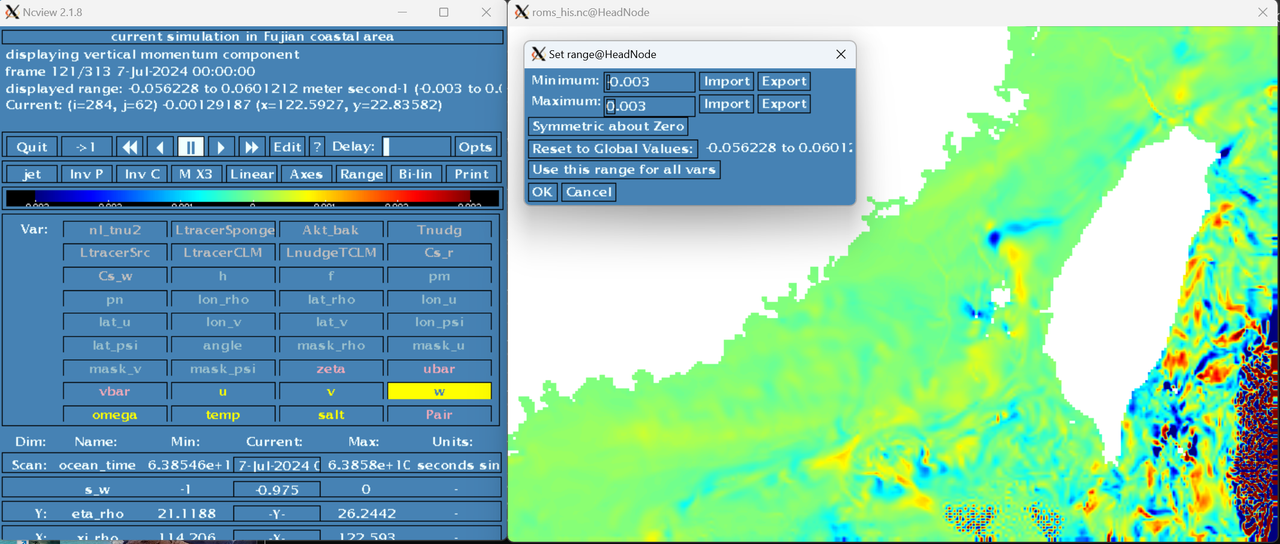
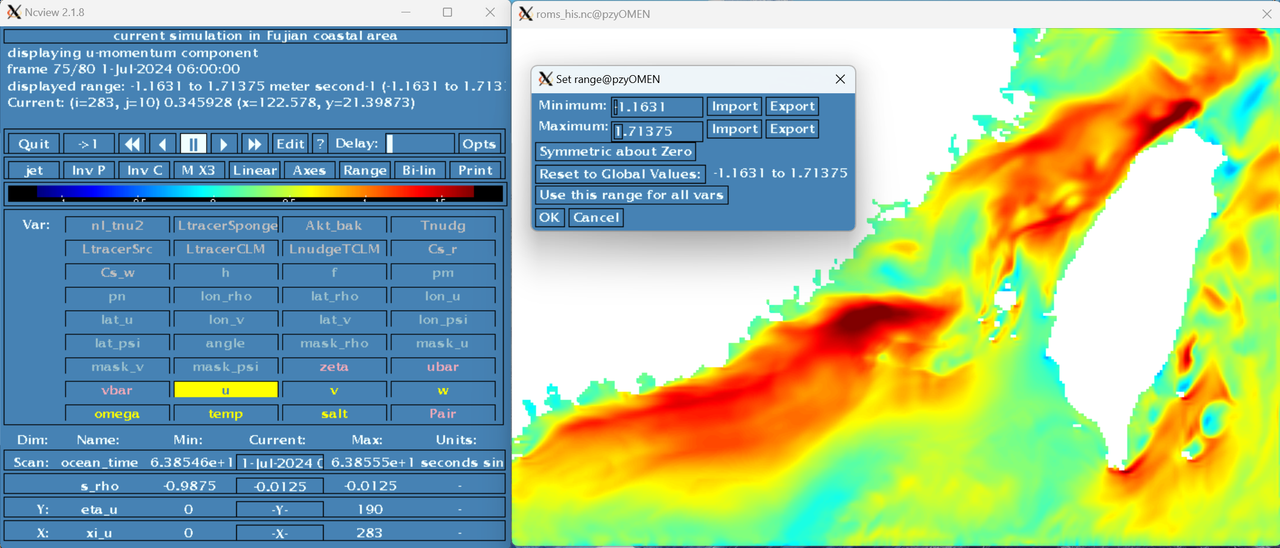
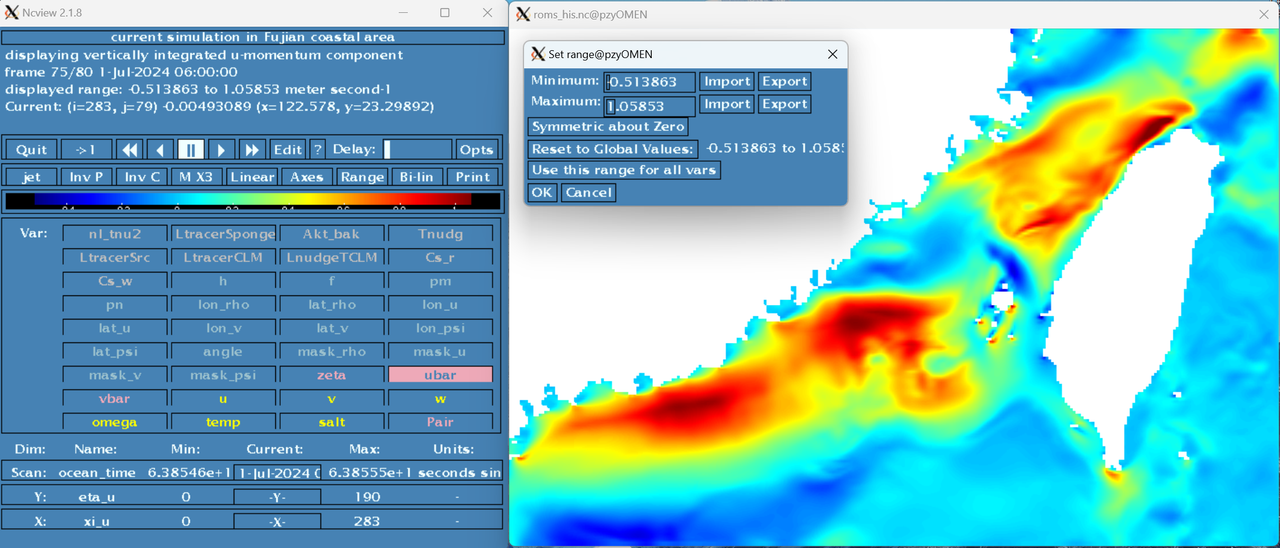
Finally, I ran a real case for ten days, and although it ran smoothly, I found that the maximum of the horizontal flow field far exceeded that of the real ocean, and there was vertical flow noise in the bottom ocean near the eastern boundary. What are the underlying reasons for this phenomenon? Should I try to improve the flow behavior at the boundary with nudge and sponge? I also tried to enable UV_U3ADV_SPLIT and UV_VIS4 to improve fake mixing, but without success. Also, my maximum 2D uv speed can reach 1, which doesn't seem very normal either.
My operation log and various files are attached below. Any kind reply would be most appreciated.